

Student Demographics


Race / Ethnicity

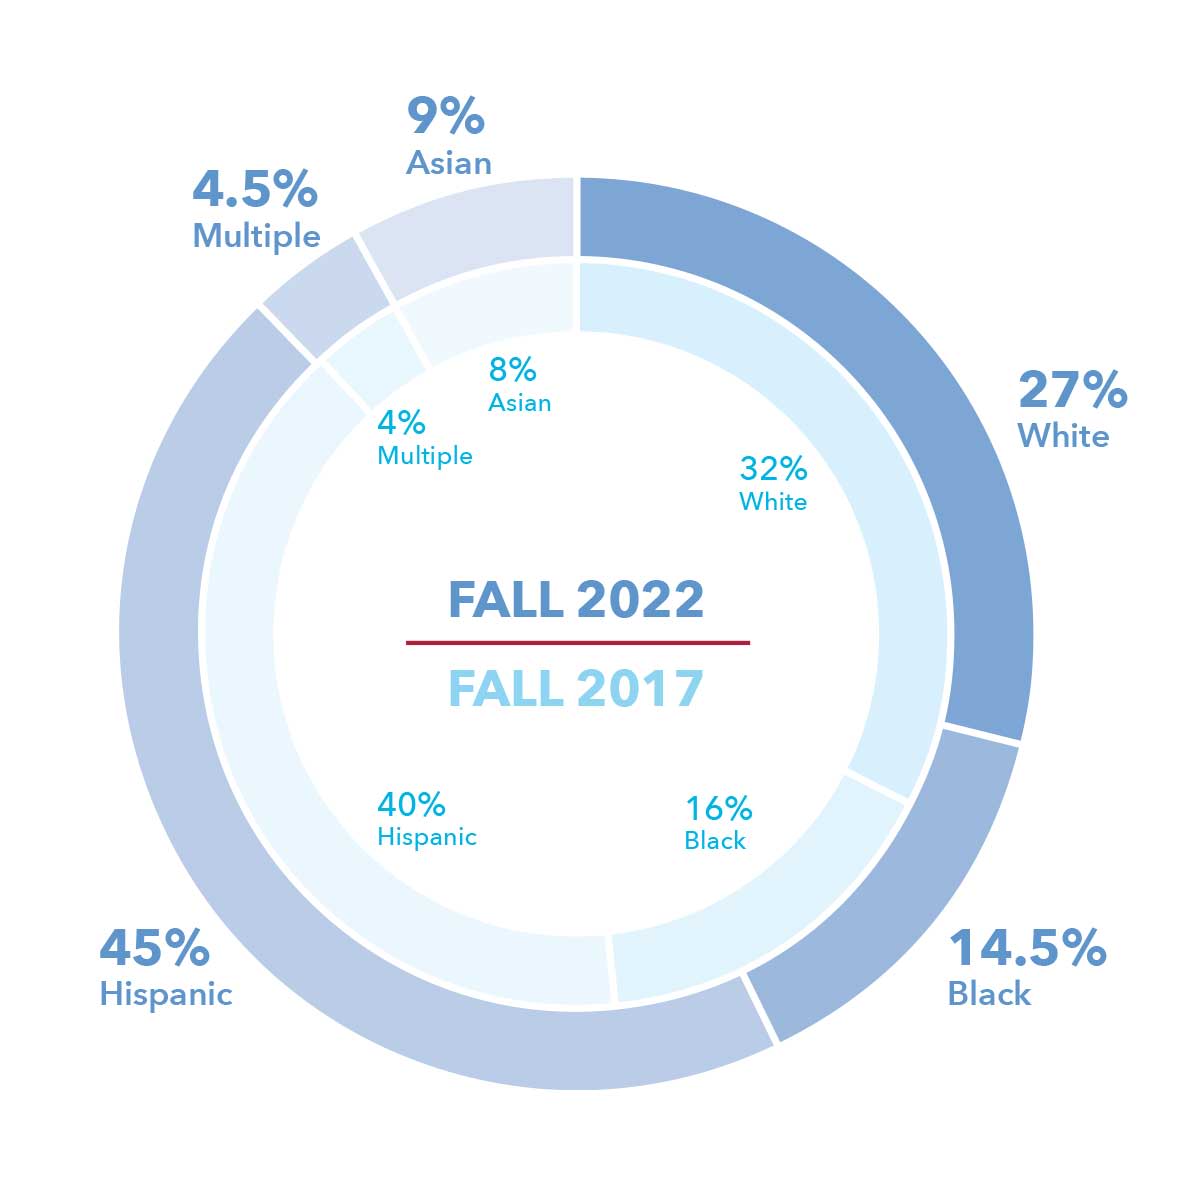
Trends
Based on Headcount Fall 2017 to Fall 2022
|
Hispanic Students |
6.5% Increase |
|---|---|
|
Asian Students |
4.5% Increase |
|
Black Students |
16.5% Decrease |
|
White Students |
19% Decrease |
|
Multiple Students |
2% Increase |
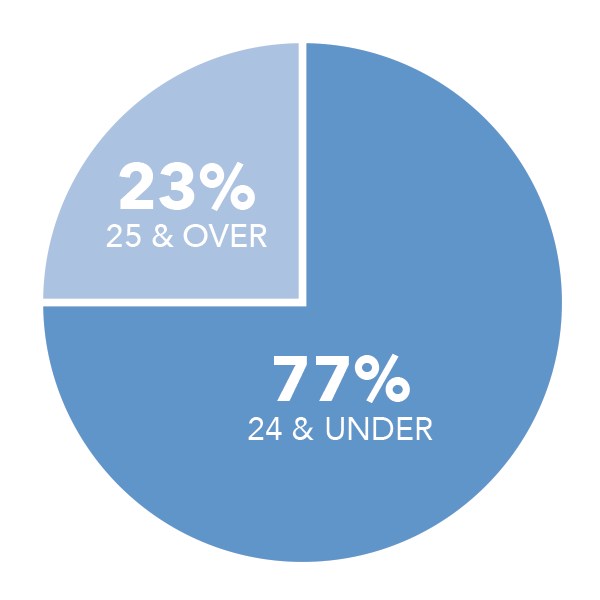
Age

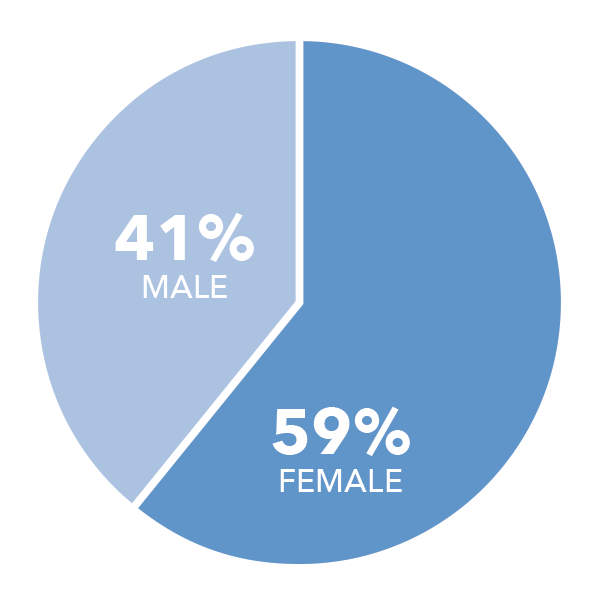
Gender
|
Full-Time |
Part-Time |
|---|---|
|
26,619 |
58,545 |
More Stories

Lone Star College Community Update 2022


Student Enrollment

Chancellor's Greeting
Lone Star College has been redefining the community college experience to support student success for 50 years.